
Today’s smoke outlook
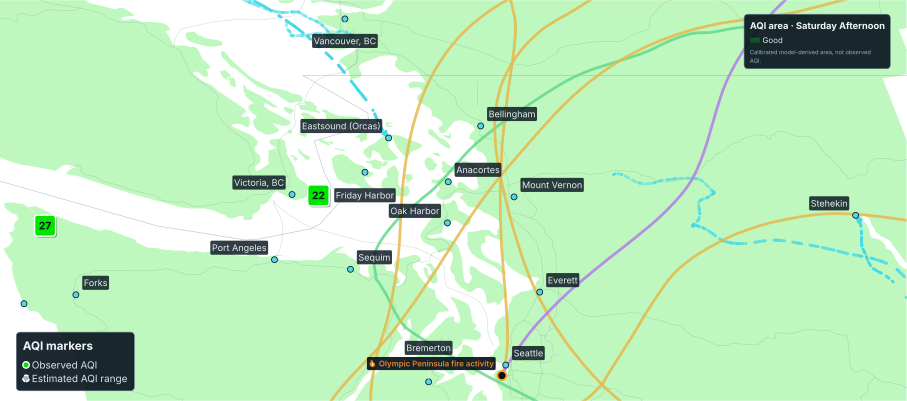
20–25 AQI
Good
Typical regional AQI · Today
The chance of smoke is low near the ground and low aloft; the most likely AQI range is 5-40. Satellite imagery shows smoke elsewhere in the wider area.
Later
20–25 AQITypical regional AQI- Peak risk
- Sunday Morning
- Smoke near ground
- Low chance
- Smoke movement
- NW → SE
- Forecast period
- Next 48 hours
Visibility & smoke aloft
- 9,800 ft
- <0.1 µg/m³ smoke
- 6,600 ft
- <0.1 µg/m³ smoke
- 3,300 ft
- <0.1 µg/m³ smoke
- 1,600 ft
- <0.1 µg/m³ smoke
- Ground (~30 ft)
- <0.1 µg/m³ smoke
- Ground visibility
- 9.7 mi visibility
- Haze light loss
- 17%/mi · ground
HRRR model guidance. Visibility includes fog and weather. Smoke values aloft are model estimates, not AQI or sensor readings. CAMS adds a broad regional haze view, not local AQI.
Why this forecast?
- N wind carries air toward S at 5 mph. Vertical mixing is limited; the chance of smoke near the ground is low.
- No major forecast input has low confidence, so overall confidence is medium.
Location AQI forecast
AQI FORECAST — EASTSOUND (ORCAS), WA
Past 48 hours (observed) • Next 48 hours (forecast) • Combined official monitors
ObservedForecastLikely rangeWider rangeTiming range
Visibility & smoke aloft near Eastsound (Orcas)
- 9,800 ft
- <0.1 µg/m³ smoke
- 6,600 ft
- <0.1 µg/m³ smoke
- 3,300 ft
- <0.1 µg/m³ smoke
- 1,600 ft
- <0.1 µg/m³ smoke
- Ground (~30 ft)
- <0.1 µg/m³ smoke
- Ground visibility
- 9.4 mi visibility
- Haze light loss
- 21%/mi · ground
HRRR model guidance. Visibility includes fog and weather. Smoke values aloft are model estimates, not AQI or sensor readings. CAMS adds a broad regional haze view, not local AQI.
AQI FORECAST — ANACORTES, WA
Past 48 hours (observed) • Next 48 hours (forecast) • Combined official monitors
ObservedForecastLikely rangeWider rangeTiming range
Visibility & smoke aloft near Anacortes
- 9,800 ft
- <0.1 µg/m³ smoke
- 6,600 ft
- <0.1 µg/m³ smoke
- 3,300 ft
- 0.3 µg/m³ smoke
- 1,600 ft
- <0.1 µg/m³ smoke
- Ground (~30 ft)
- <0.1 µg/m³ smoke
- Ground visibility
- 10 mi visibility
- Haze light loss
- 23%/mi · ground
HRRR model guidance. Visibility includes fog and weather. Smoke values aloft are model estimates, not AQI or sensor readings. CAMS adds a broad regional haze view, not local AQI.
AQI FORECAST — SEATTLE, WA
Past 48 hours (observed) • Next 48 hours (forecast) • Combined official monitors
ObservedForecastLikely rangeWider rangeTiming range
Visibility & smoke aloft near Seattle
- 9,800 ft
- <0.1 µg/m³ smoke
- 6,600 ft
- 0.3 µg/m³ smoke
- 3,300 ft
- 0.6 µg/m³ smoke
- 1,600 ft
- 0.1 µg/m³ smoke
- Ground (~30 ft)
- <0.1 µg/m³ smoke
- Ground visibility
- 9.1 mi visibility
- Haze light loss
- 17%/mi · ground
HRRR model guidance. Visibility includes fog and weather. Smoke values aloft are model estimates, not AQI or sensor readings. CAMS adds a broad regional haze view, not local AQI.
AQI FORECAST — PORT ANGELES, WA
Past 48 hours (observed) • Next 48 hours (forecast) • Combined official monitors
ObservedForecastLikely rangeWider rangeTiming range
Visibility & smoke aloft near Port Angeles
- 9,800 ft
- <0.1 µg/m³ smoke
- 6,600 ft
- <0.1 µg/m³ smoke
- 3,300 ft
- <0.1 µg/m³ smoke
- 1,600 ft
- <0.1 µg/m³ smoke
- Ground (~30 ft)
- <0.1 µg/m³ smoke
- Ground visibility
- 8.1 mi visibility
- Haze light loss
- 14%/mi · ground
HRRR model guidance. Visibility includes fog and weather. Smoke values aloft are model estimates, not AQI or sensor readings. CAMS adds a broad regional haze view, not local AQI.
AQI FORECAST — FORKS, WA
Past 48 hours (observed) • Next 48 hours (forecast) • Combined official monitors
ObservedForecastLikely rangeWider rangeTiming range
Visibility & smoke aloft near Forks
- 9,800 ft
- <0.1 µg/m³ smoke
- 6,600 ft
- <0.1 µg/m³ smoke
- 3,300 ft
- <0.1 µg/m³ smoke
- 1,600 ft
- <0.1 µg/m³ smoke
- Ground (~30 ft)
- <0.1 µg/m³ smoke
- Ground visibility
- 12 mi visibility
- Haze light loss
- 13%/mi · ground
HRRR model guidance. Visibility includes fog and weather. Smoke values aloft are model estimates, not AQI or sensor readings. CAMS adds a broad regional haze view, not local AQI.
AQI FORECAST — MOUNT VERNON, WA
Past 48 hours (observed) • Next 48 hours (forecast) • Combined official monitors
ObservedForecastLikely rangeWider rangeTiming range
Visibility & smoke aloft near Mount Vernon
- 9,800 ft
- <0.1 µg/m³ smoke
- 6,600 ft
- 0.1 µg/m³ smoke
- 3,300 ft
- 0.2 µg/m³ smoke
- 1,600 ft
- <0.1 µg/m³ smoke
- Ground (~30 ft)
- <0.1 µg/m³ smoke
- Ground visibility
- 8.9 mi visibility
- Haze light loss
- 21%/mi · ground
HRRR model guidance. Visibility includes fog and weather. Smoke values aloft are model estimates, not AQI or sensor readings. CAMS adds a broad regional haze view, not local AQI.
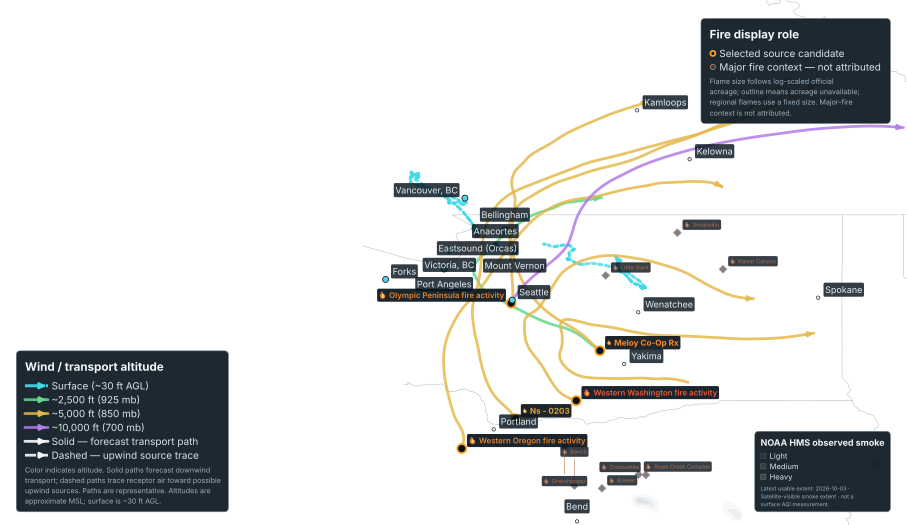
Smoke movement
During midday, winds mostly carry air from NW toward SE. The most plausible smoke sources are Western Washington fire activity, Olympic Peninsula fire activity, Western Oregon fire activity.
REGIONAL SOURCES AND TRANSPORT
SAN JUAN ISLANDS
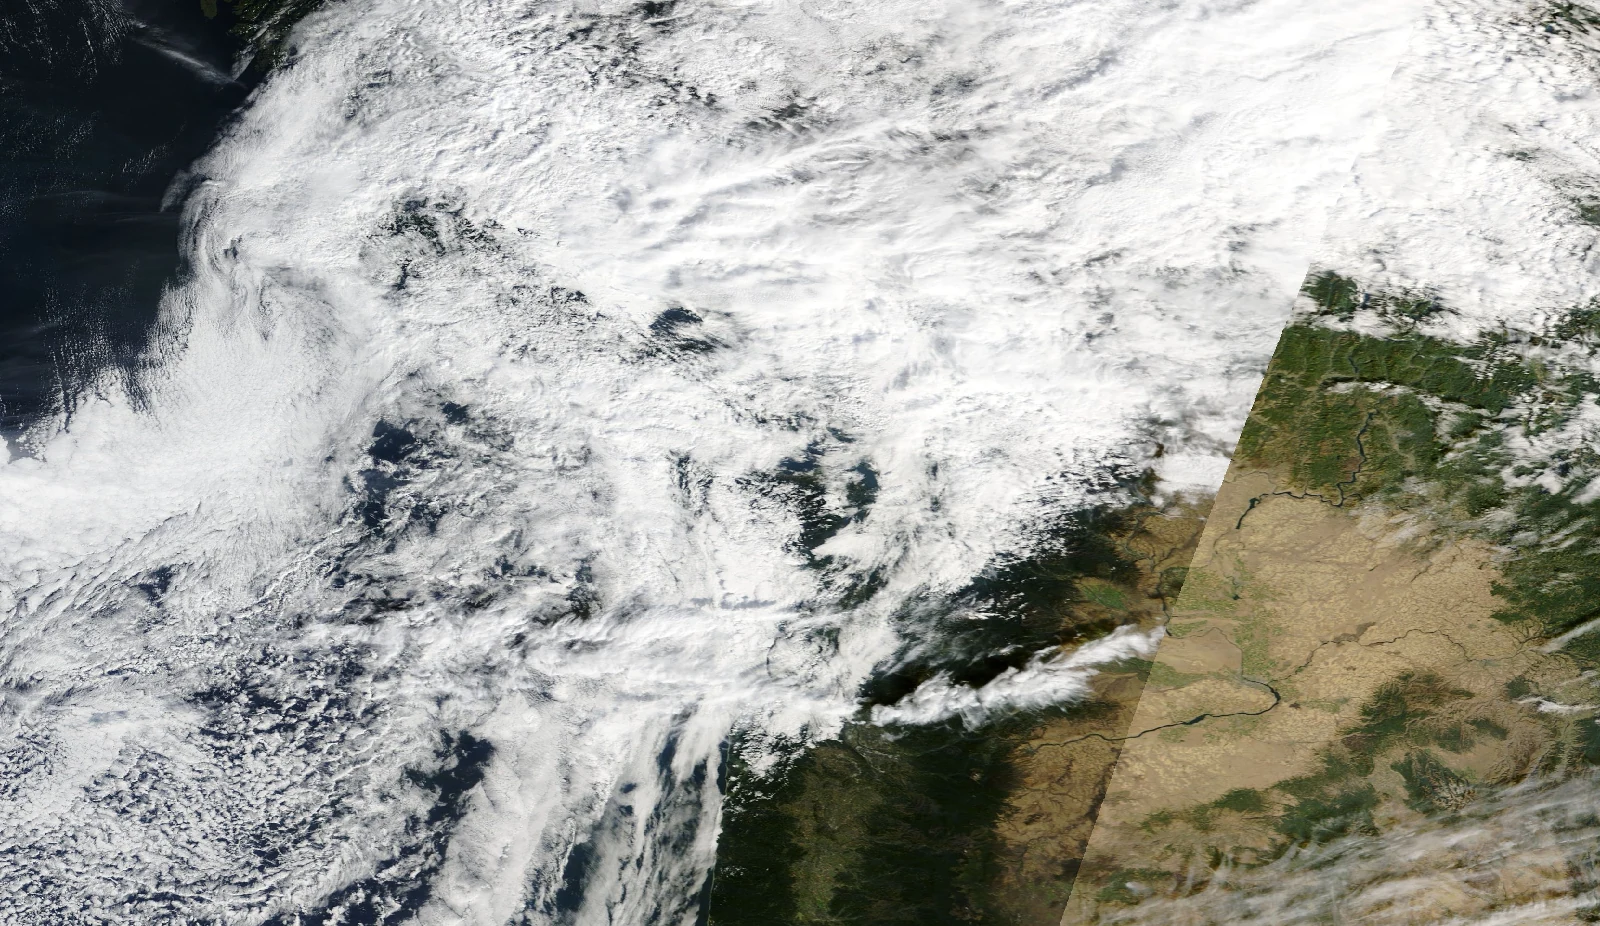
Latest satellite
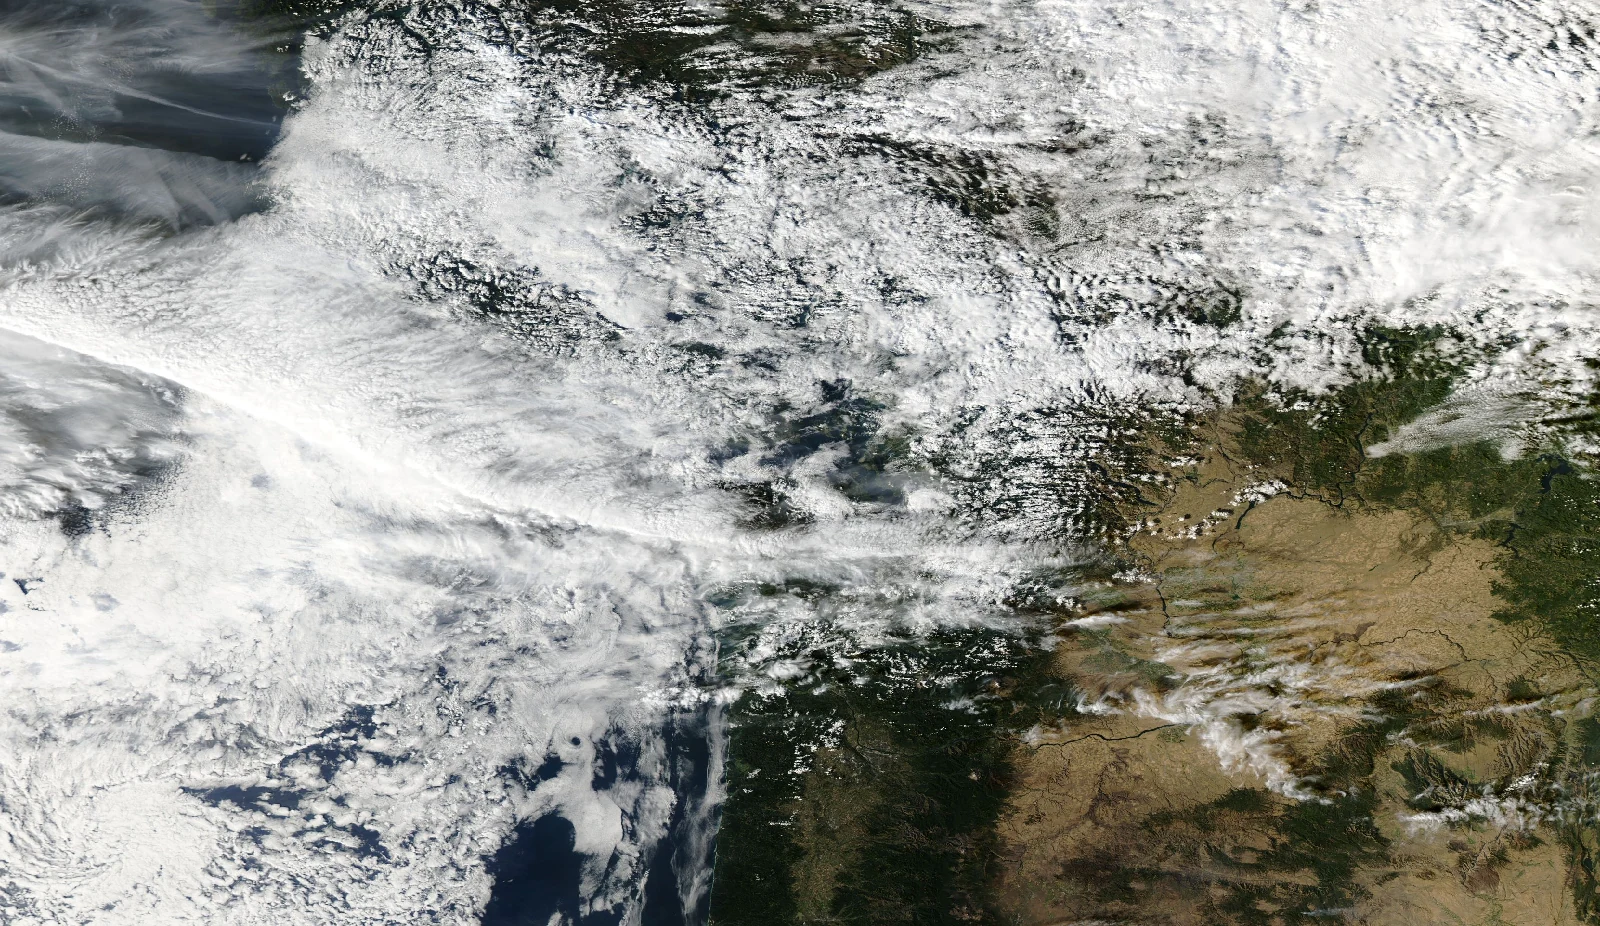





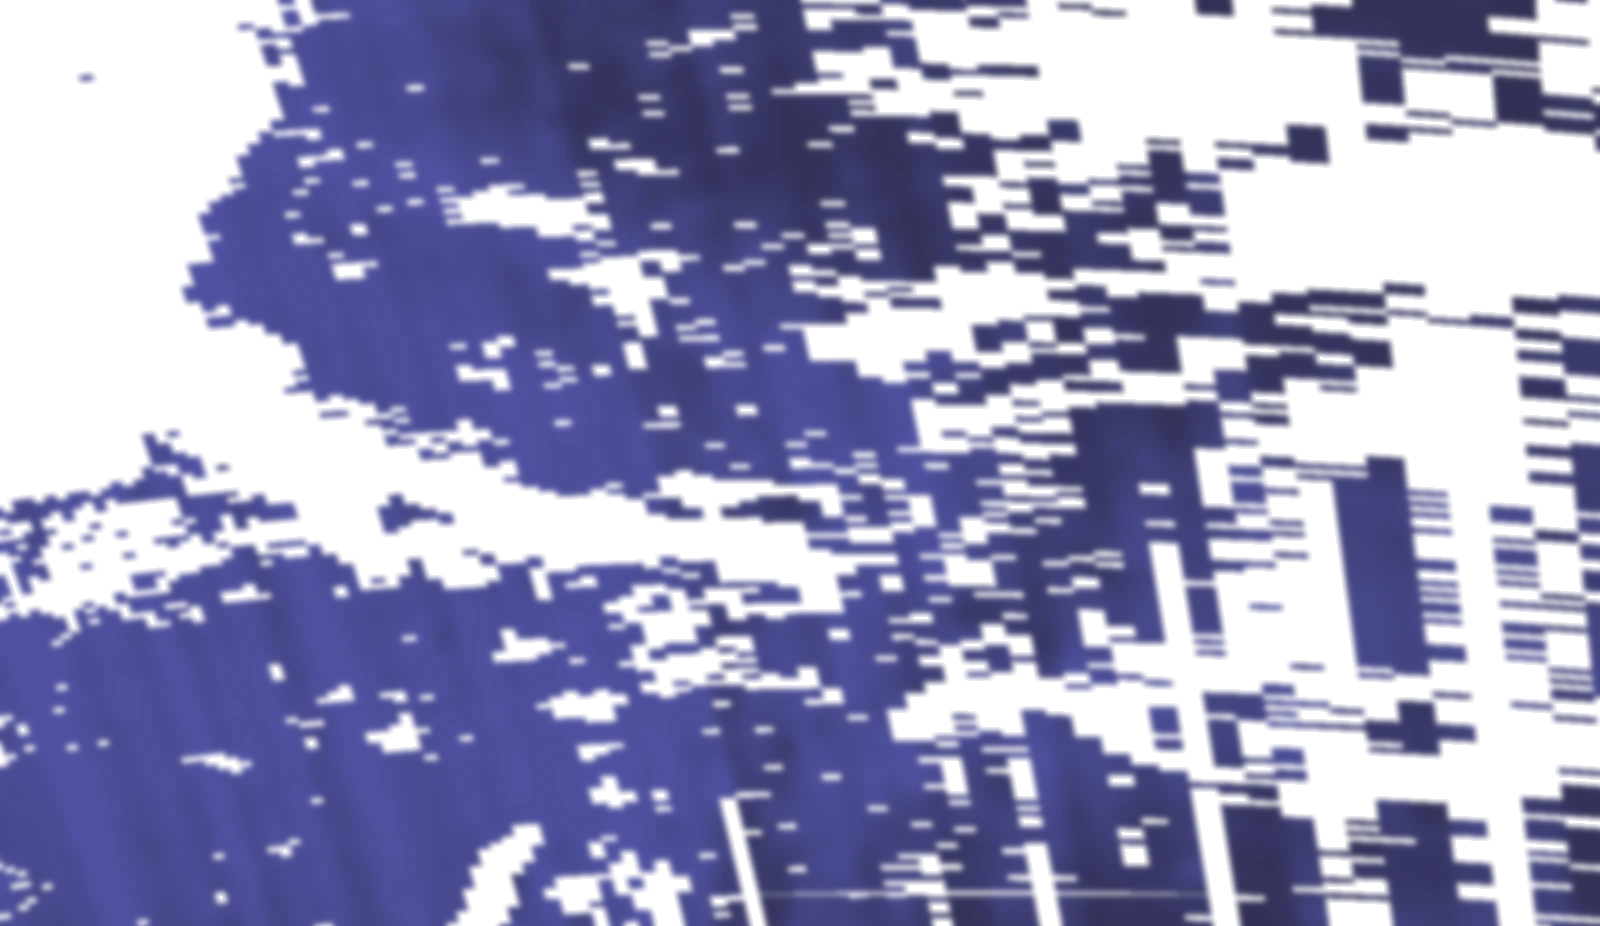
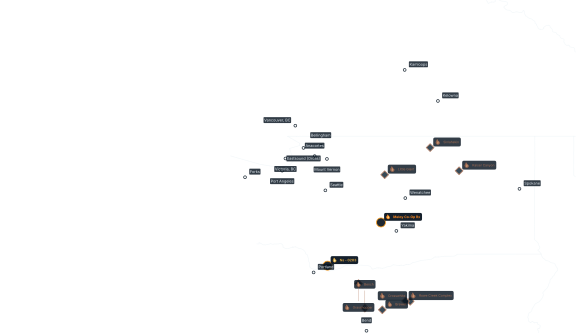
Lower haze signalStronger haze signal
Lower carbon monoxideHigher carbon monoxide
Aqua / MODIS · October 2, 2026 · approx. early-afternoon satellite pass
Retrieved October 2, 2026 at 7:21 PM PDT
NASA EOSDIS GIBS · True-color imagery; clouds and smoke may look similar. Not a surface AQI measurement. ?
Possible smoke sources
Sources are ranked by plausibility, not by how much smoke each produced.
| Rank | Source | Potential | Why |
|---|---|---|---|
| 1 | High | Grouped regional activity High potential from 1 unidentified fire cluster in this region. | |
| 2 | Medium | Grouped regional activity Medium potential from 1 unidentified fire cluster in this region. | |
| 3 | Medium | Grouped regional activity Medium potential from 1 unidentified fire cluster in this region. | |
| 4 | Medium | Verified Medium potential based on recent fire activity and winds toward the forecast area. | |
| 5 | Low | Verified Low potential based on recent fire activity and winds toward the forecast area. |
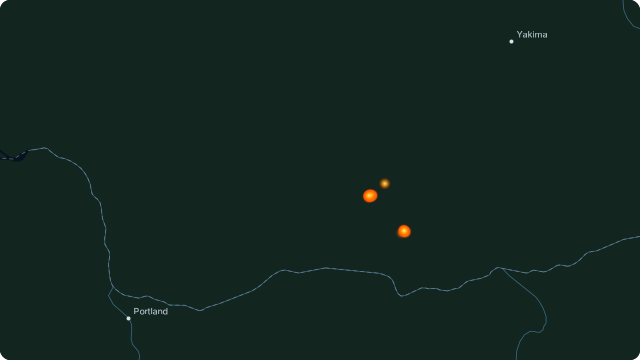
Official mapped fire area
Recent satellite heat detection
Satellite heat detections through Oct 3, 12:52 PM PDT
High potential. High potential from 1 unidentified fire cluster in this region.
Fire boundaries show the total mapped area. Satellite heat points can indicate fire activity, but not exact flame edges, smoke levels, or which fire caused local smoke.
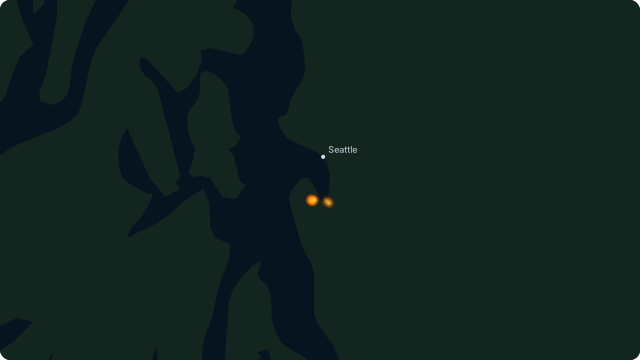
Official mapped fire area
Recent satellite heat detection
Satellite heat detections through Oct 3, 3:26 AM PDT
Medium potential. Medium potential from 1 unidentified fire cluster in this region.
Fire boundaries show the total mapped area. Satellite heat points can indicate fire activity, but not exact flame edges, smoke levels, or which fire caused local smoke.
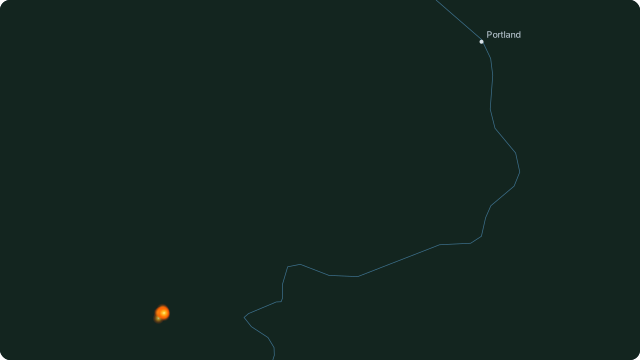
Official mapped fire area
Recent satellite heat detection
Satellite heat detections through Oct 3, 4:47 AM PDT
Medium potential. Medium potential from 1 unidentified fire cluster in this region.
Fire boundaries show the total mapped area. Satellite heat points can indicate fire activity, but not exact flame edges, smoke levels, or which fire caused local smoke.

Official mapped fire area
Recent satellite heat detection
No satellite heat-detection time was available.
Medium potential. Medium potential based on recent fire activity and winds toward the forecast area.
Fire boundaries show the total mapped area. Satellite heat points can indicate fire activity, but not exact flame edges, smoke levels, or which fire caused local smoke.
Official mapped fire area
Recent satellite heat detection
No satellite heat-detection time was available.
Low potential. Low potential based on recent fire activity and winds toward the forecast area.
Fire boundaries show the total mapped area. Satellite heat points can indicate fire activity, but not exact flame edges, smoke levels, or which fire caused local smoke.
Source details
Forecast confidence
MediumSome uncertainty remains
Most needed data is available, but smoke arrival and AQI can still change.
- Biggest uncertainty: No major forecast input has low confidence, so overall confidence is medium.
About this forecast
This forecast combines fire detections, official fire reports, weather and smoke-movement models, satellite images, and ground sensors to estimate smoke conditions.
How it works and its limits
- The internal evidence score is 77/100. It summarizes how much supporting information is available; it is not a probability or accuracy score.
- Source rankings show plausibility, not each fire's share of the smoke.
- Satellite heat detections do not show exact fire boundaries.
- Wind-path lines show where air may travel, not the actual smoke plume.
- HRRR-Smoke is a model estimate, not a PM2.5 sensor reading or AQI.
- HRRR-Smoke values are not directly converted into AQI.
- The local AQI map is calibrated from model data; it is not an observation.
- NOAA's shaded smoke areas show smoke seen from satellites, not ground-level PM2.5 or AQI.